

Why AWS Bedrock AgentCore Observability Problems Happen and How to Stop It
AgentCore observability issues usually come down to missing instrumentation, incomplete CloudWatch setup, or confusion between sessions, traces, and spans. For teams searching for amazon bedrock agentcore observability guidance, the practical fix is to verify the telemetry path first, then separate short-term debugging from permanent production monitoring using Amazon Bedrock official information and the Mobileye AgentCore case study. A critical reading of the available material suggests that observability should not be treated as a dashboard-only feature. Enterprise customer support operations teams automating workflows and ML engineers deploying production AI agents on AWS need three linked views at minimum: session-level context, trace-level execution flow, and span-level timing detail. In practice, that structure is what makes it possible to explain why a trace is missing, why latency rises, or why an agent appears to fail silently.
The Trace Not Showing Issue: Why It Happens
When users ask, “why is my bedrock agentcore trace not showing,” the pattern is usually operational rather than mysterious. The failure often starts before visualization: telemetry was never emitted, the environment was not connected to the expected log or tracing path, or the team is looking for trace data without enabling the search and storage path needed to retrieve it. A practical takeaway is to treat missing traces as a pipeline validation problem, not only a UI problem.
The most useful conceptual model has 3 layers: sessions, traces, and spans. Sessions capture the broader conversation or workflow state, traces capture a single end-to-end execution, and spans capture the internal timed steps inside that execution. Review analysis shows that teams who collapse these layers into one view struggle to isolate whether the problem sits in memory, orchestration, tool calls, or downstream services; start from the Amazon Bedrock product information and map each failed run to those 3 layers before changing code.
Usually, teams notice the gap only after a production incident because silent paths are easy to miss in multi-step automation. The risk is higher in a multi-agent architecture using Amazon Bedrock, where one controller agent may succeed while a specialist agent fails without clear handoff visibility. That is why transaction search in CloudWatch matters: if search is not enabled or queryable, trace discovery becomes inconsistent and operators may wrongly assume the agent never ran.
Sessions, Traces, and Spans: The Relationship That Often Gets Missed
Troubleshooting becomes much faster when these entities are separated cleanly. One session can contain multiple traces, and one trace can contain multiple spans. If a user sees a bad answer after several retries, the session may be healthy while only 1 trace contains the real fault; if a trace looks complete but one tool call took too long, a single span may be the source of the issue.
Why Multi-Agent Systems Complicate Visibility
Does agentcore observability work with multi-agent architectures? It can, but the limitation is correlation discipline. Once a router agent delegates work to other agents, visibility weakens unless the execution path preserves IDs, timing boundaries, and tool results across every branch. The Mobileye support-operations story is useful here because it frames AgentCore in real operational workflows rather than isolated demos.
Quick Fixes Users Can Try Right Now
If the immediate goal is to fix bedrock agentcore tracing not working, the fastest approach is a short verification loop. First, run one controlled request with a unique session identifier. Second, verify logs and trace-related events land where operators expect them. Third, query CloudWatch transaction search before testing the UI. Fourth, confirm that the request path includes the tool, memory, and handoff steps that should have generated spans.
A practical takeaway is that quick fixes should reduce ambiguity, not just restart services. Use a single reproducible prompt, a single environment, and a single trace target. That 4-step isolation pattern is more reliable than changing multiple variables at once, and it aligns with how to debug bedrock agent failures in production without creating fresh noise; begin with the official Amazon Bedrock information and validate one path at a time.
For teams asking how to monitor Amazon Bedrock AgentCore agents during an active incident, basic latency checks should focus on queue delay, model invocation delay, tool-call delay, and memory lookup delay. If only the total runtime is visible, the agent may look slow even when the model is fine and the bottleneck is actually a downstream system. That limitation is why span-level instrumentation is not optional for serious support automation.
How to Set Up AgentCore Harness for Debugging
The amazon bedrock agentcore harness setup should be treated as a controlled test bench, not a production mirror. Keep the harness narrow: one reproducible input set, fixed tools, explicit environment variables, and verbose span names. In practice, that makes it easier to compare healthy and failing traces because the differences stay attributable rather than accidental.
How to Fix AgentCore Agents Failing Silently
Silent failure usually means the workflow ends without a surfaced exception, without a user-facing error, or without a closing span that explains the stop point. The repair is usually structural: emit explicit error spans, set timeout boundaries around tool calls, and log fallback paths instead of allowing them to disappear into generic completion states. User reports indicate that this matters most in support operations where an agent may appear successful while quietly skipping escalation or case enrichment.
The Permanent Solution (Best Practice)
The permanent solution is to design observability into the agent contract itself. That means every production workflow should define what a session represents, what starts and ends a trace, and which actions deserve their own spans. Without those rules, teams cannot compare latency across runs, cannot reason about memory drift, and cannot explain user-visible failures with confidence.
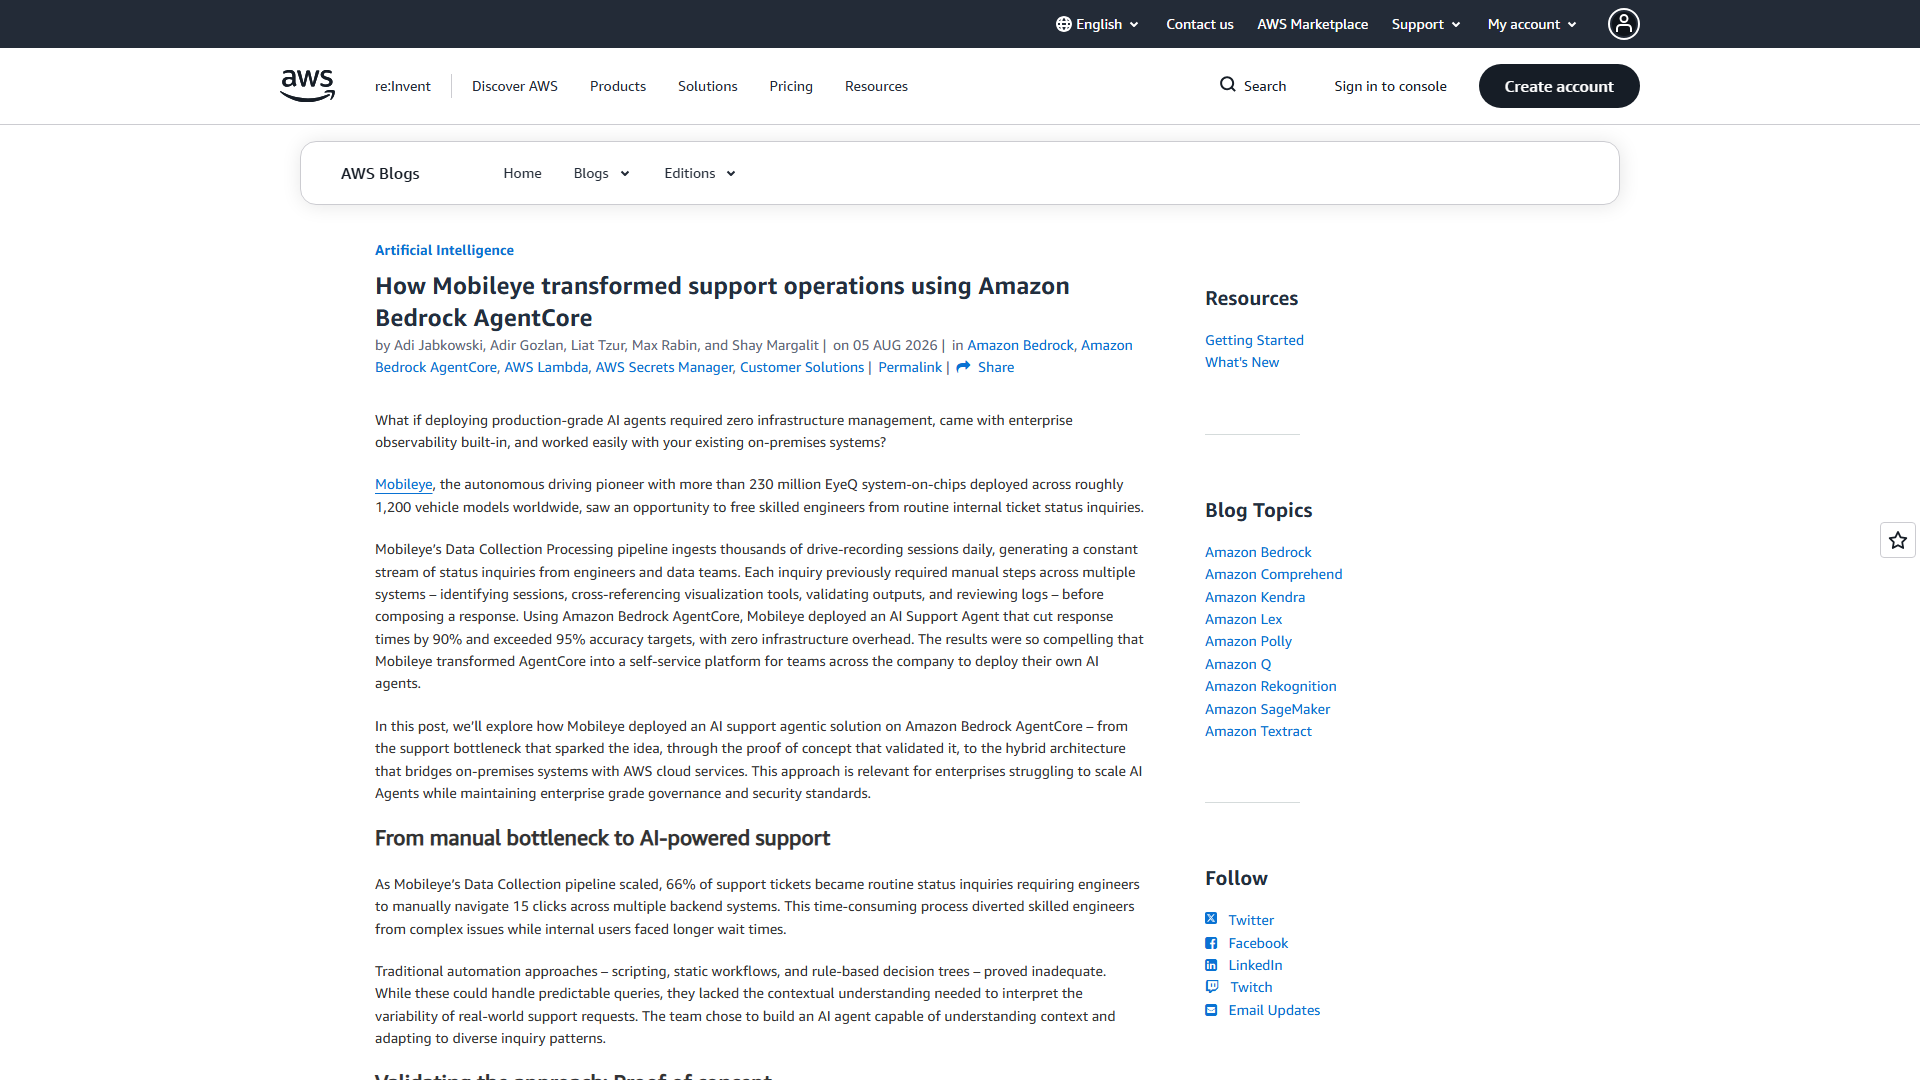
For enterprise support teams, the best practice is to align observability with business outcomes rather than raw logs. A case-routing agent, for example, should expose whether it retrieved context, chose a routing path, called any tools, and produced an escalation decision. The Mobileye AgentCore example is relevant because it ties Bedrock AgentCore to support operations, which is exactly where auditability and failure attribution matter most.
A durable monitoring model usually includes 5 signal categories: request volume, latency, error events, memory/session integrity, and handoff quality between agents. Review analysis shows that this 5-signal model is more useful than generic infrastructure monitoring because it distinguishes model behavior from orchestration behavior. If the team wants a baseline comparison, it is also reasonable to compare the visibility model against alternatives such as Azure AI Foundry and Google Vertex AI, especially for multi-agent orchestration standards and trace correlation depth.
What Metrics Does Amazon Bedrock AgentCore Observability Provide?
The most decision-useful metrics are the ones that explain behavior rather than simply proving activity. Teams should expect to monitor latency, failure paths, tool execution timing, session continuity, and trace completeness. In practice, if the telemetry only answers “did it run” but not “where did it slow down or break,” the observability layer is still incomplete.
How Do I Monitor Agent Latency in AgentCore?
Monitor latency by breaking the request into timed spans instead of relying on one end-to-end duration. At minimum, create separate timing for model inference, external tool calls, retrieval or memory access, and agent-to-agent handoffs. That produces a more defensible latency profile for production reviews and makes cross-team escalation easier.
Preventing Observability Gaps in the Future
Prevention is mostly about operational discipline. A team that waits for production incidents before defining trace boundaries will spend more time debating symptoms than fixing causes. Usually, teams notice that observability gaps cluster around release changes, new tools, and expanded agent autonomy, so those are the first places where guardrails should be added.
A prevention checklist should include 4 recurring controls: trace-schema reviews, session-retention reviews, negative-path tests, and environment parity checks. Those 4 controls are practical because they address the most common causes of broken observability without assuming that all failures come from the model itself; they also fit the broader AWS guidance to review current platform details on the Amazon Bedrock official site before standardizing internal runbooks.
Memory and session issues deserve their own prevention lane. How to troubleshoot agentcore memory and session issues becomes easier when memory writes, reads, expirations, and resets are visible as explicit steps in the trace. If memory is opaque, teams can misdiagnose stale context as a reasoning failure, and that leads to the wrong remediation.
Prerequisites Teams Often Underestimate
The prerequisites are not only technical permissions and services. Teams also need naming conventions, owner assignment, and agreement on what constitutes a failed run. Without that shared definition, alerting will be noisy and post-incident reviews will stay inconclusive.
Pros and Cons of the AWS Approach
The advantage of staying inside the AWS ecosystem is operational alignment with existing logging and security controls. The limitation is that teams may overestimate how much visibility comes automatically; observability quality still depends on disciplined instrumentation, especially for multi-agent architecture using Amazon Bedrock and memory-heavy workflows.
When to Contact Support vs DIY
DIY troubleshooting makes sense when traces are merely incomplete, naming is inconsistent, or one environment differs from another. Those cases usually improve with better harness design, clearer span boundaries, and CloudWatch search verification. Escalation makes more sense when telemetry disappears across known-good workflows, account-level configuration appears inconsistent, or the platform behavior conflicts with current AWS documentation.
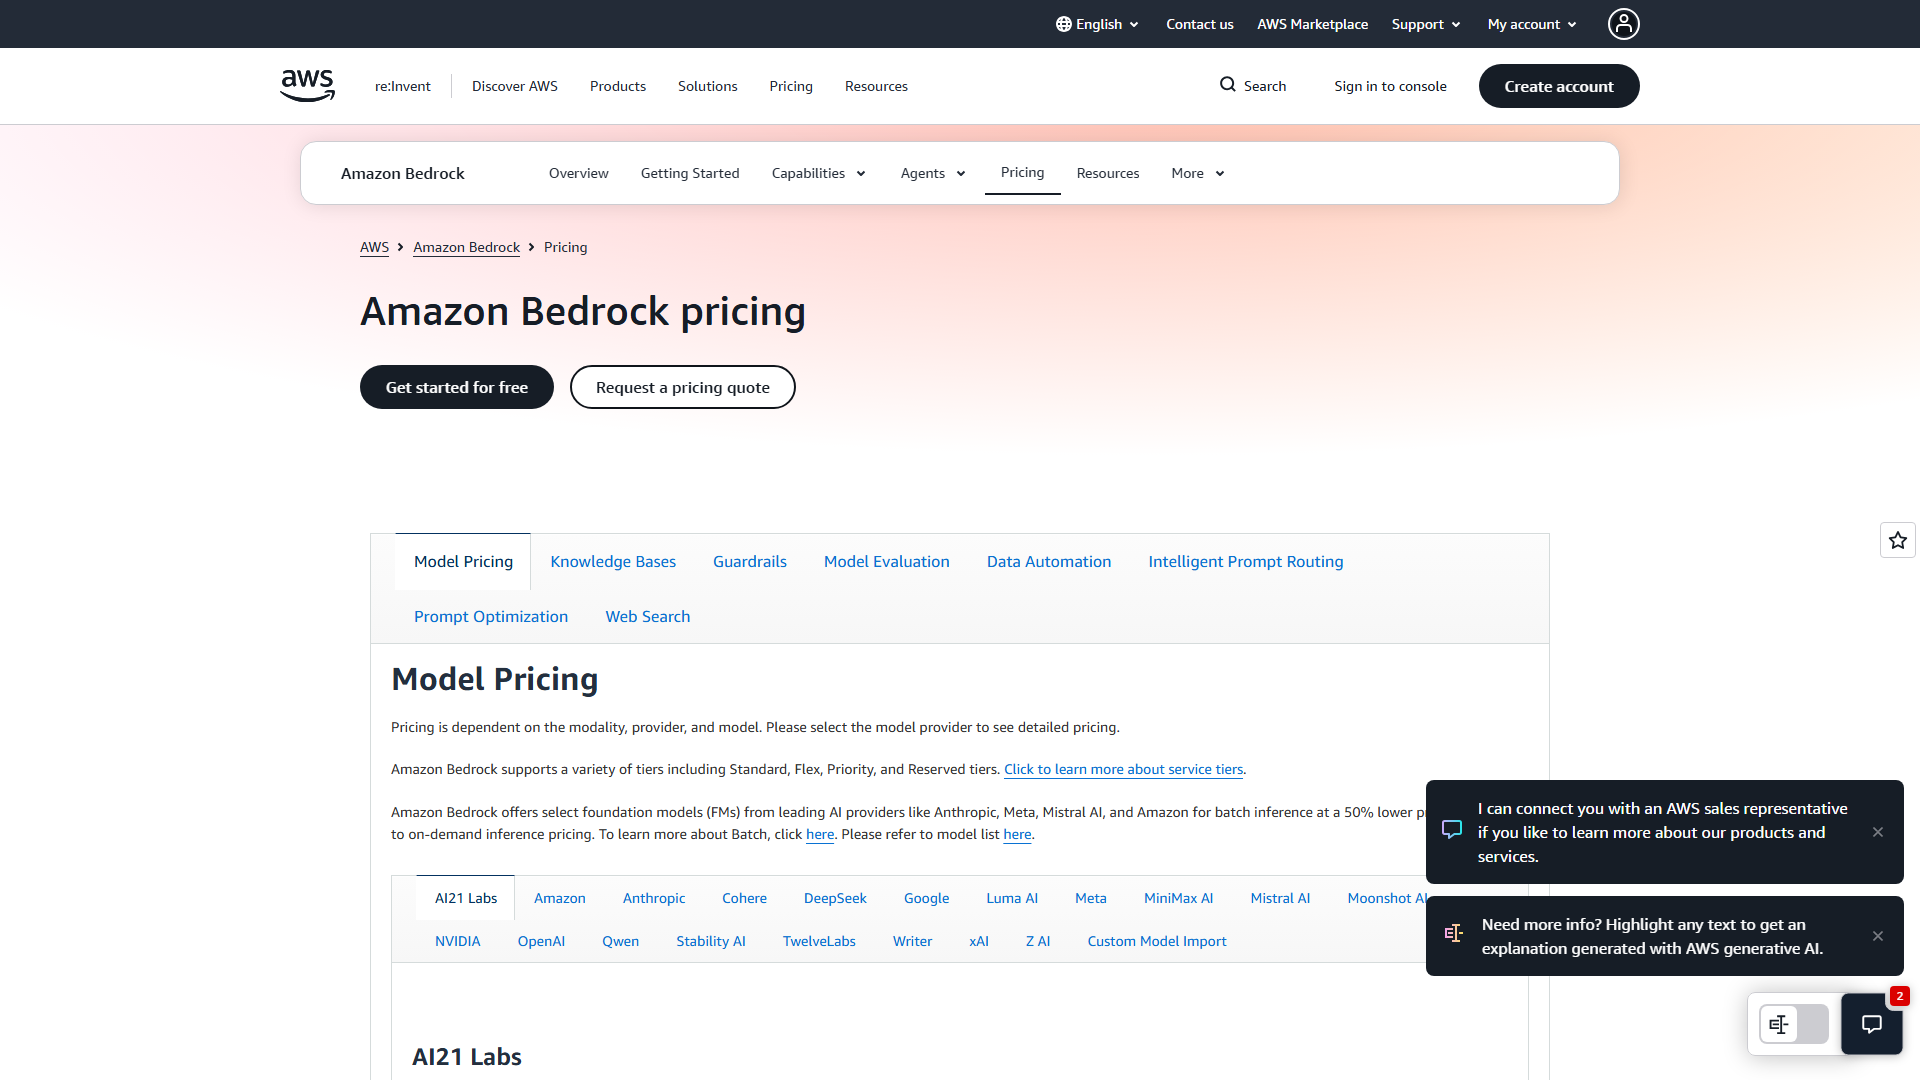
Cost questions should also be handled carefully. How much does Bedrock AgentCore observability cost is not something to answer from memory because AWS pricing changes and usage patterns vary. The safer position is to confirm current charges and billing dimensions on the official Bedrock pricing page, then compare that spending against the operational cost of missed incidents, slow escalations, and manual case triage.
In practice, support should be contacted after 2 internal checkpoints fail: first, the team cannot prove whether telemetry was emitted; second, the team cannot reproduce the issue in a controlled harness. That 2-checkpoint rule prevents premature escalation while still recognizing that account, regional, or service-level issues are sometimes outside the application team’s control. A practical takeaway is to escalate with a clean evidence bundle: session ID, trace expectation, affected environment, and a minimal failing reproduction.
Competitor Context: When AWS Is Not the Only Option
For teams doing commercial investigation, it is reasonable to compare AWS Bedrock with Azure AI Foundry and Google Vertex AI. The decision should focus less on marketing claims and more on trace depth, multi-agent correlation, memory inspection, and how easily support and ML teams can share one debugging workflow.
Final Assessment
Amazon Bedrock AgentCore observability is most useful when teams approach it as an evidence system rather than a dashboard feature. The recurring pattern behind missing traces, silent failures, and confusing latency is not a single bug but weak correlation between sessions, traces, spans, and operational ownership.
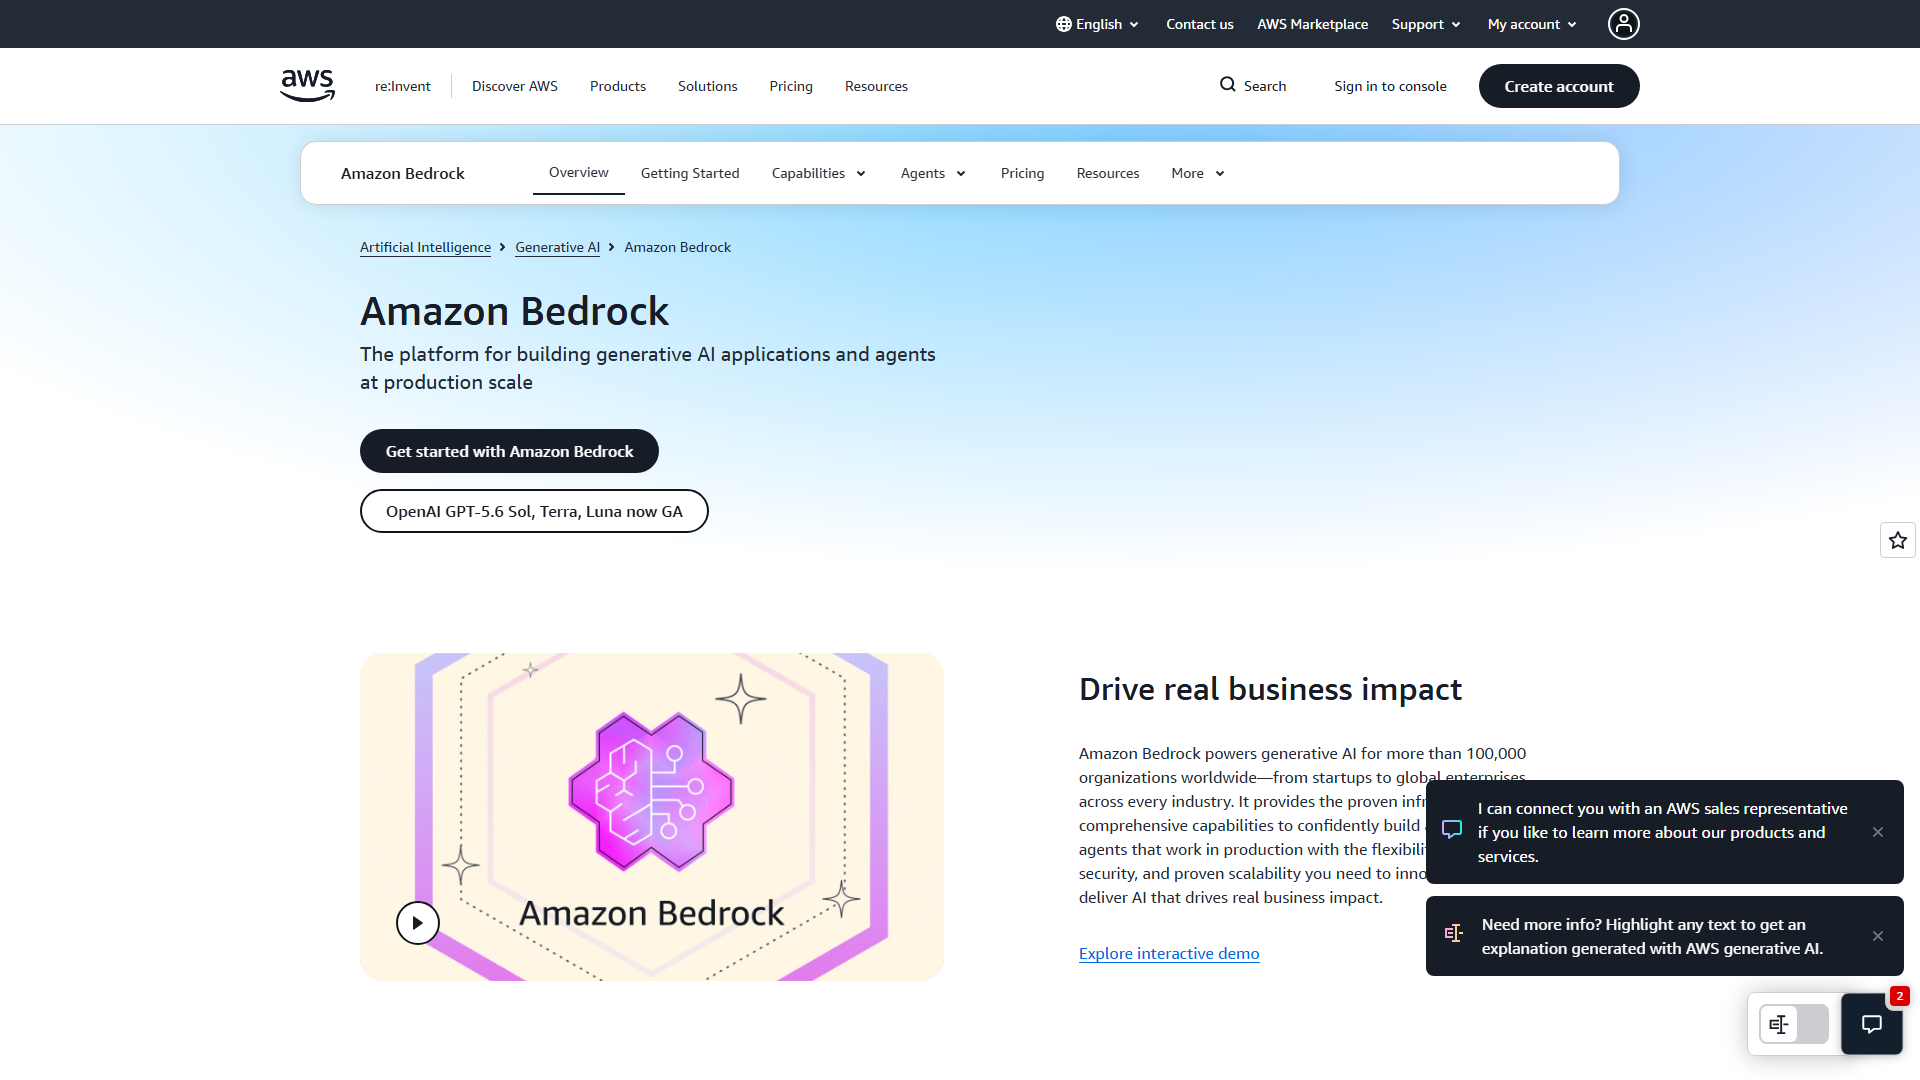
For support operations teams and ML engineers, the durable path is straightforward: validate CloudWatch transaction search, standardize instrumentation, use a controlled harness for debugging, and escalate only after reproducible evidence is collected. Readers planning budgets should verify current billing details on the official pricing page, while those evaluating fit should review the Amazon Bedrock overview and the Mobileye AgentCore example to judge whether the platform’s observability model matches their workflow complexity.